Claude Charts
I had an interesting chat with a friend this weekend about household spending by category. He went into Claude and immediately produced a compelling visualization and report (screenshot below): https://claude.ai/public/artifacts/c4ebed8b-96f3-4974-8057-7ffca3acc3d7. 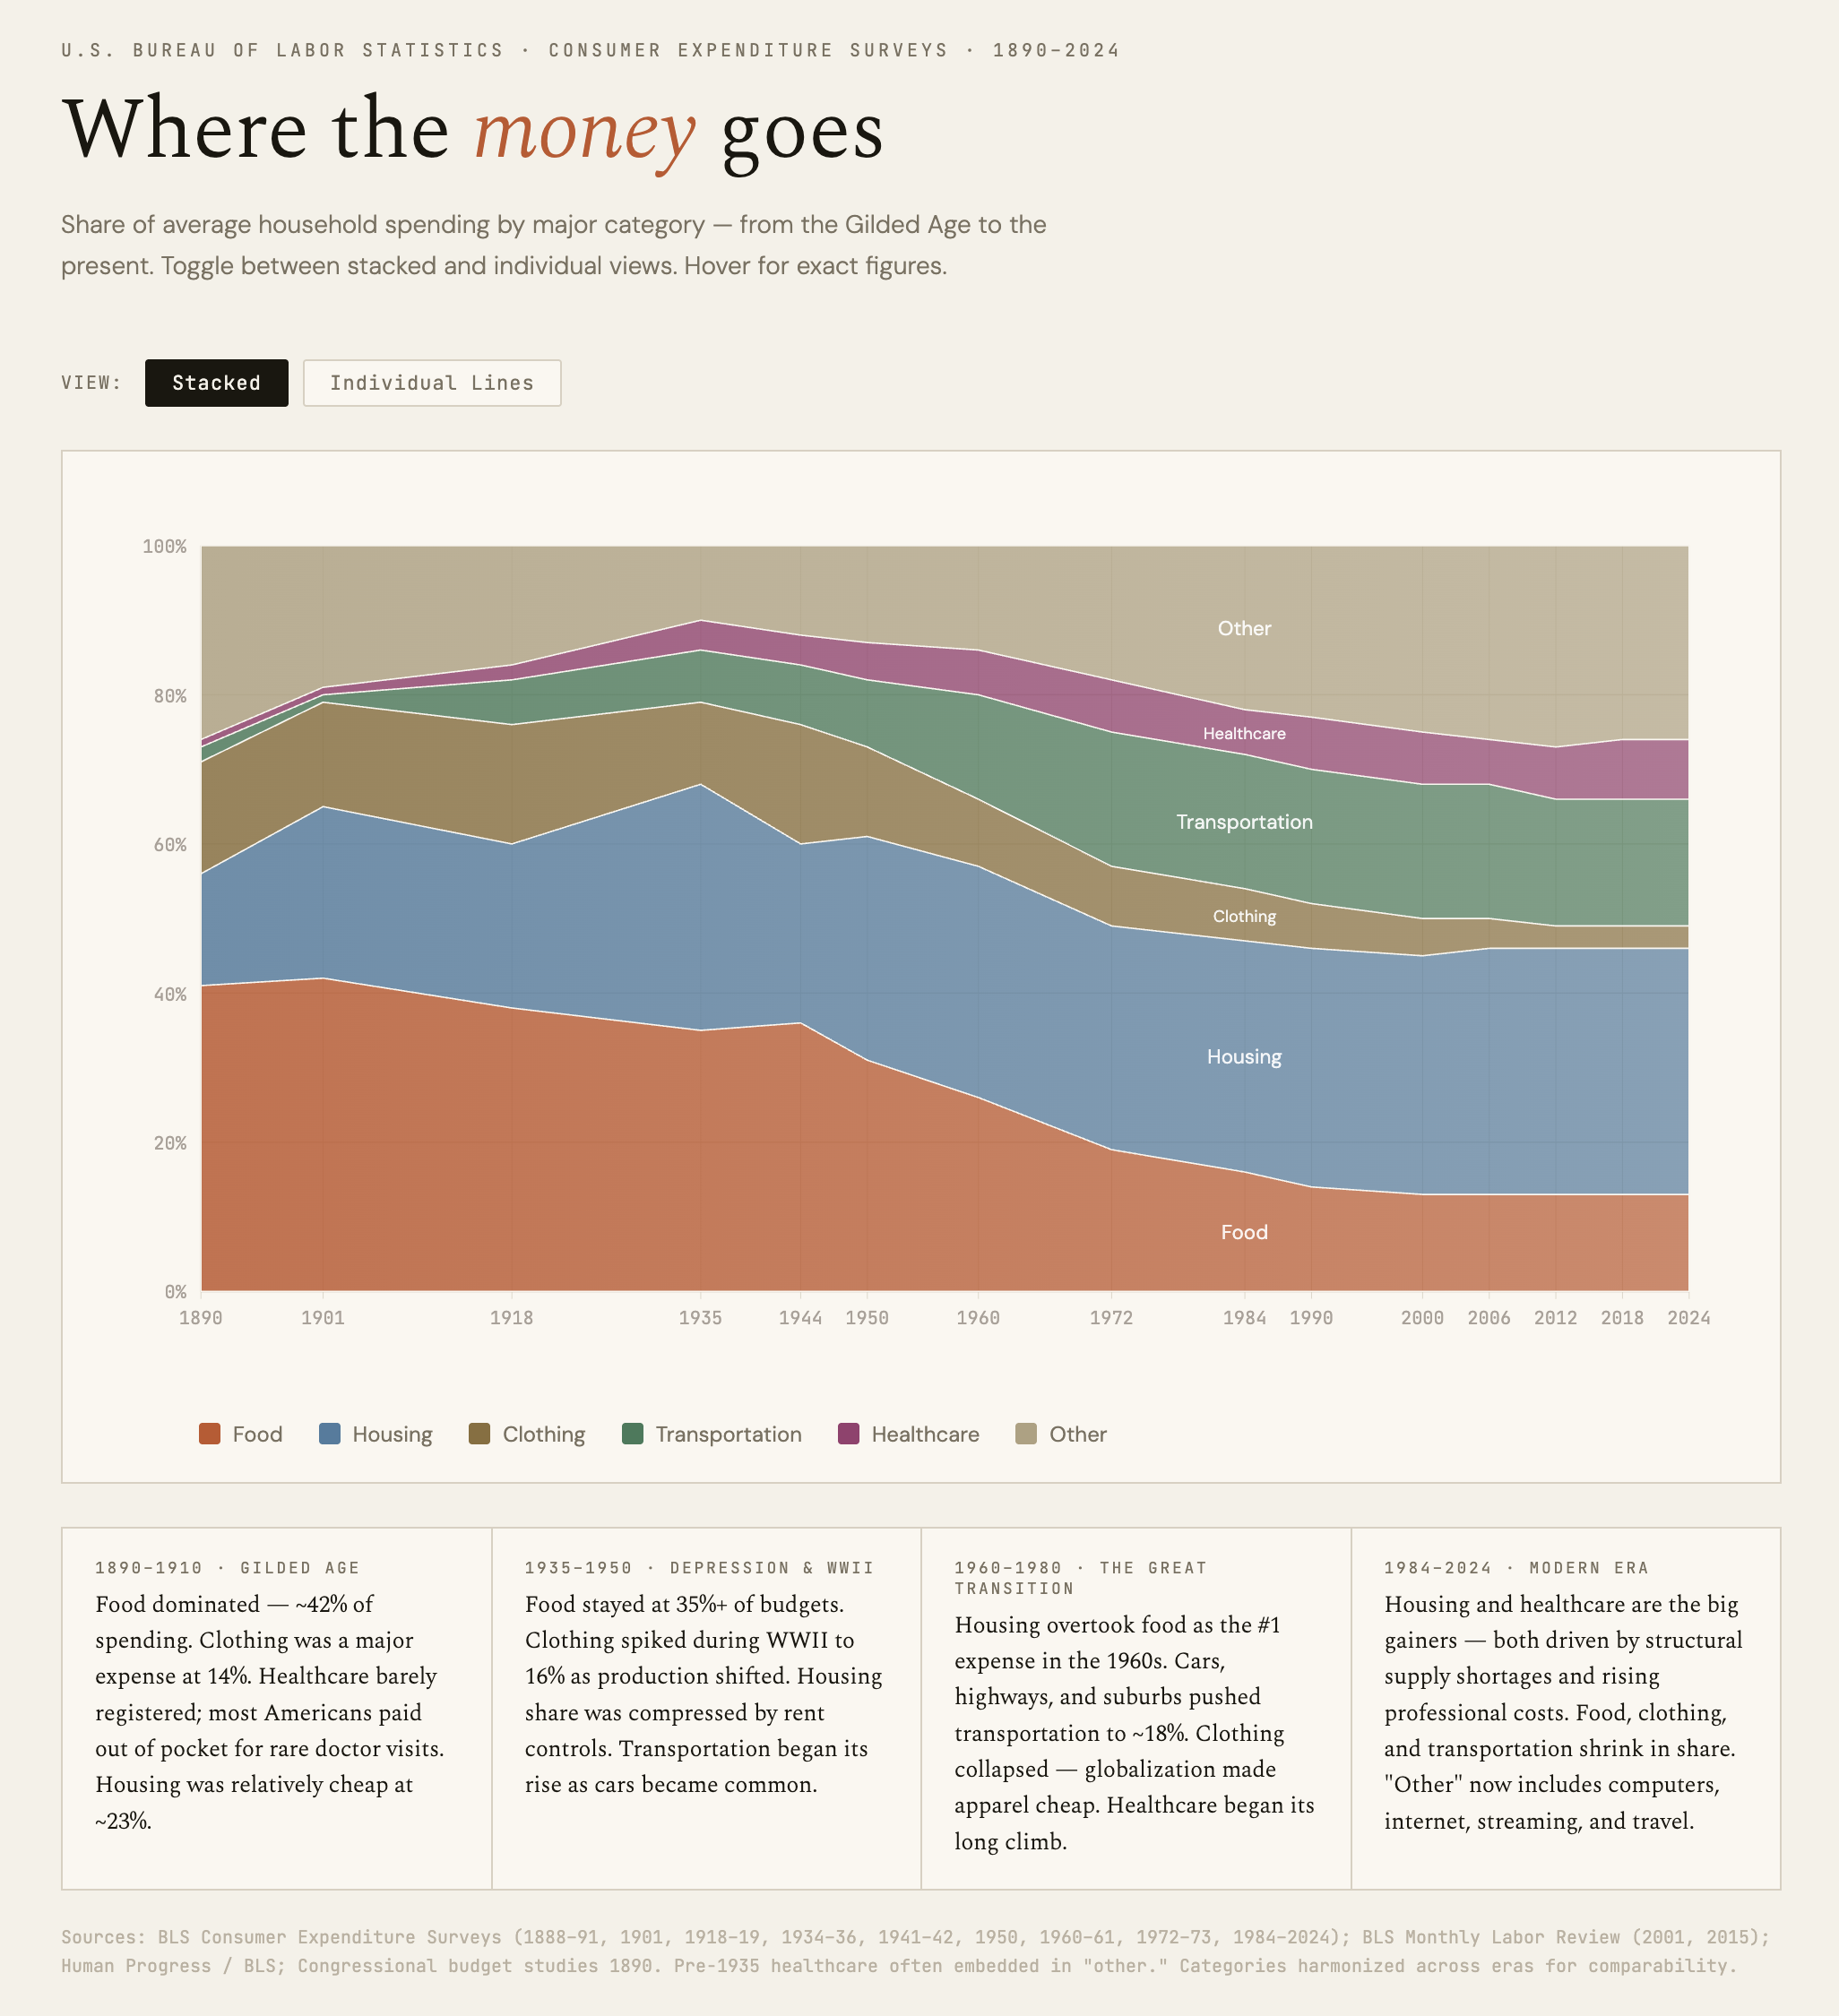
My Attempt
I tried to produce something on my corporate Claude account, but it was notably less compelling: https://claude.ai/artifacts/27d13513-6914-4348-9c6d-1defc97b8e91. It's embedded below as well:
130 Years of US Household Spending
Share of total annual expenditures · BLS Consumer Expenditure Survey, 1901–2024Dashed lines show major historical events
Sources: BLS Consumer Expenditure Survey; BLS Report 991 "100 Years of U.S. Consumer Spending" (2006). Pre-2010 data from decennial/biennial surveys — years between are interpolated. Categories harmonized across eras; "Other" includes insurance, pensions, education, personal care, entertainment (pre-1950), and miscellaneous.
Takeaways
- There's still a lot of randomness to how AI assistants produce charts.
- Claude's defaults looked pretty great for my friend, but less so for me.