SPLASH
SPLASH is a statistical analysis platform for hydrologists. It focuses on extracting data from WDM and DSS files and performing statistical analyses and charts.
It is built with Streamlit, Plotly, Python, and Rust, and is absolutely a work in progress. I will include a link here once it is deployed live.
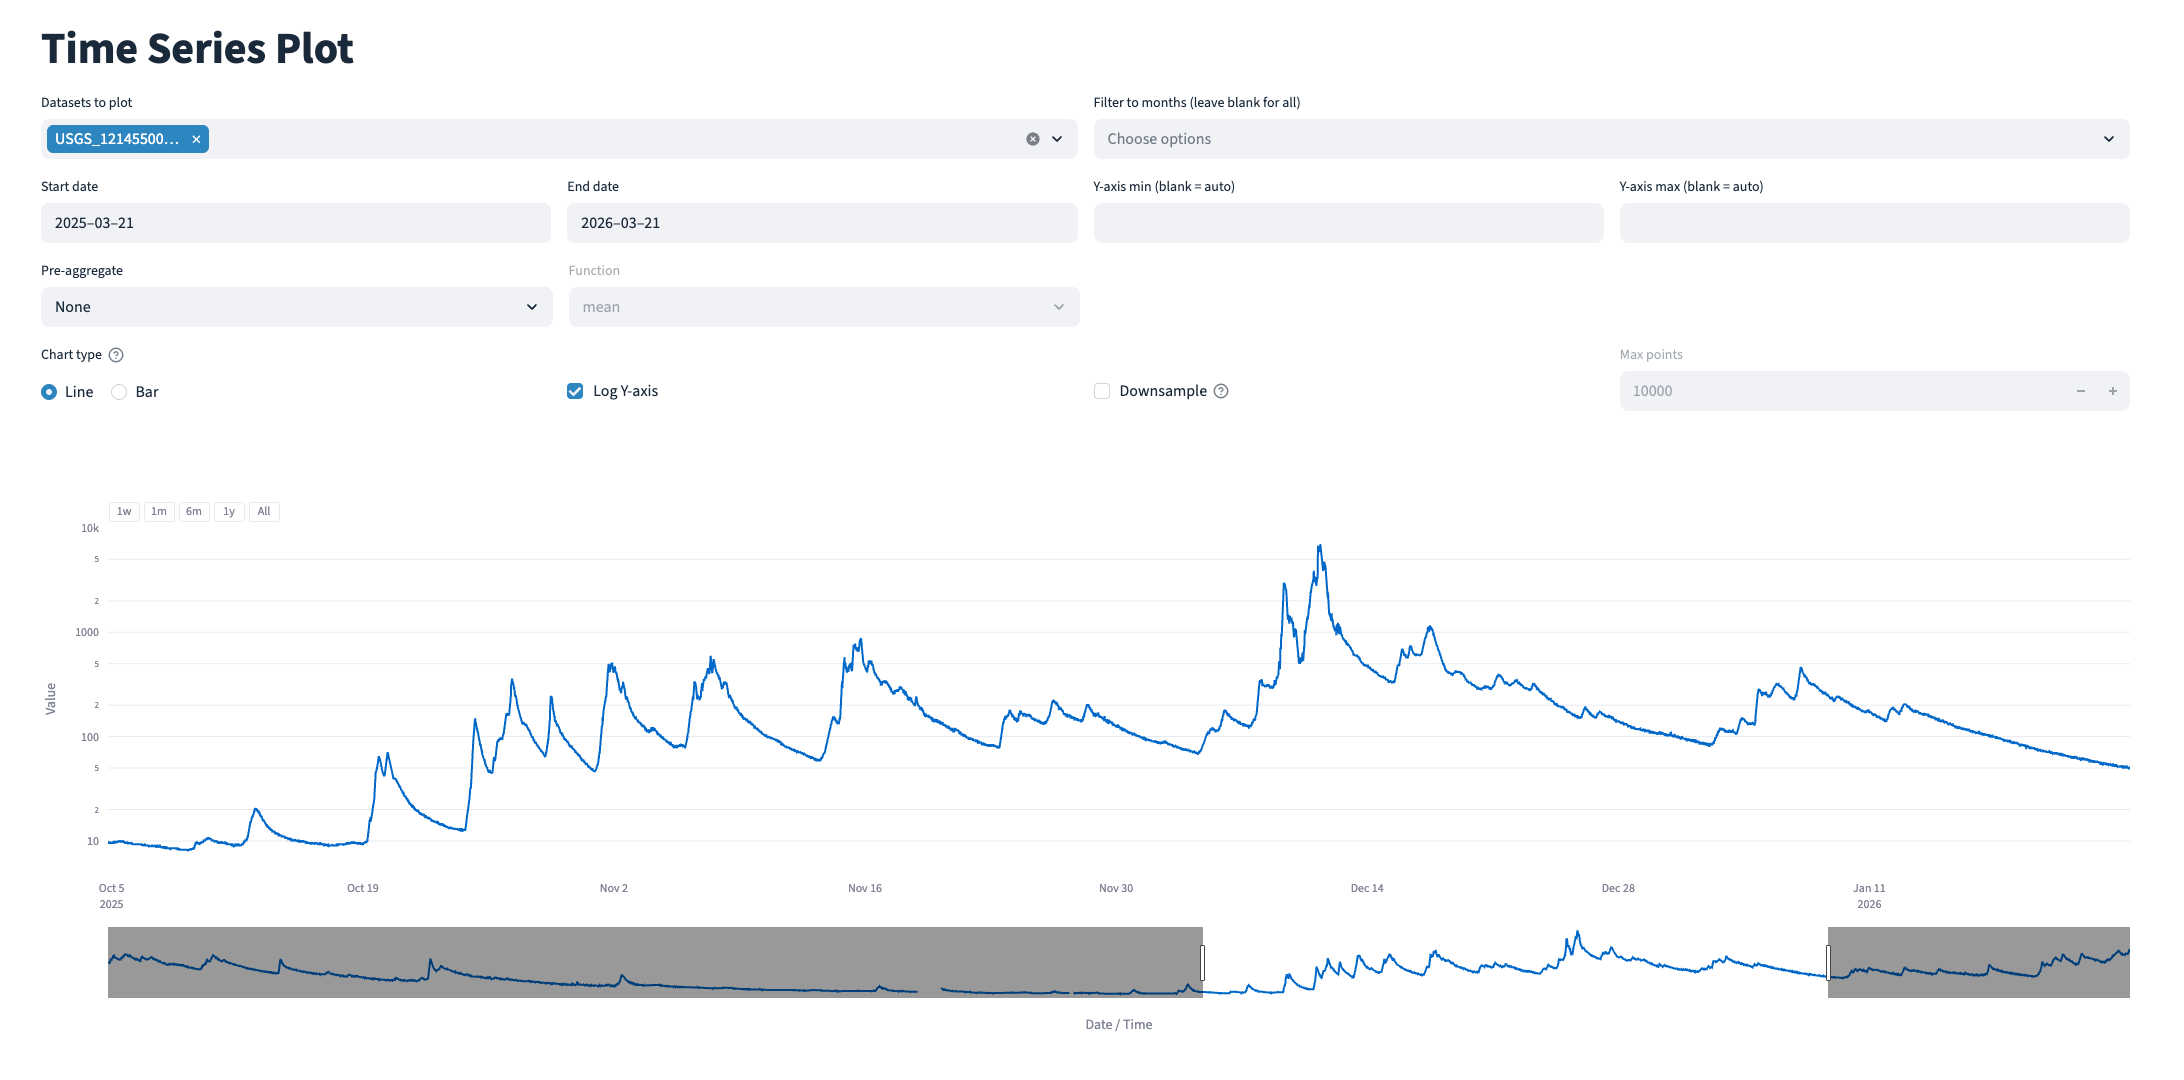
Overview plot:
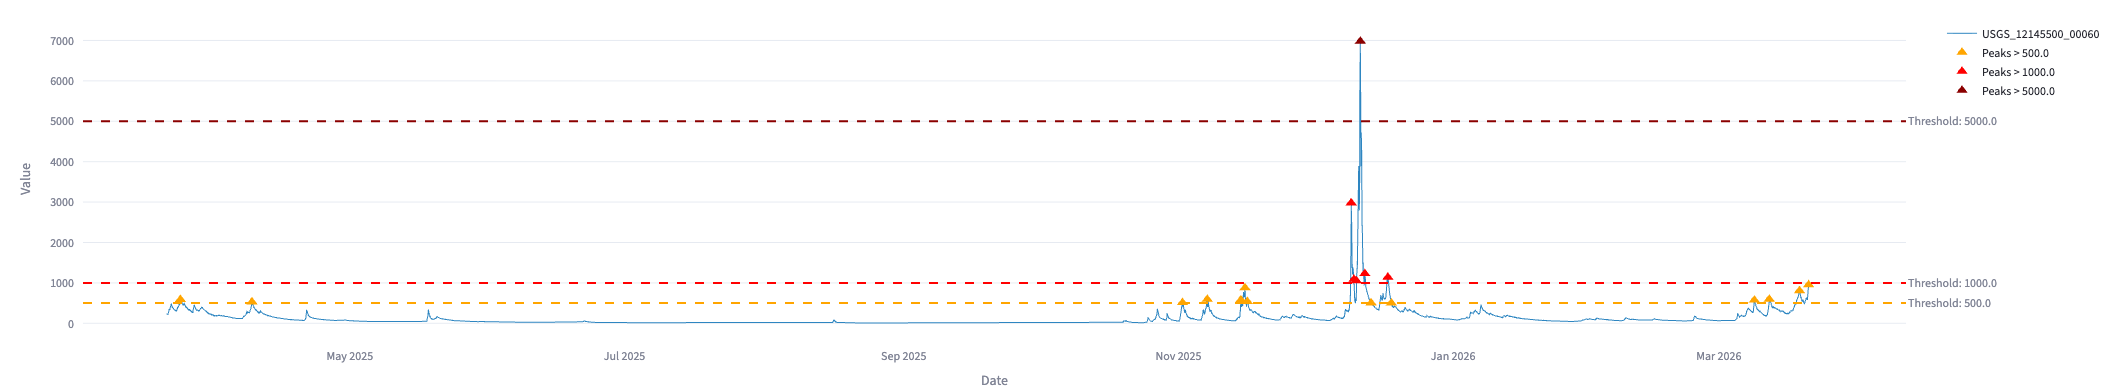
Peaks analysis:
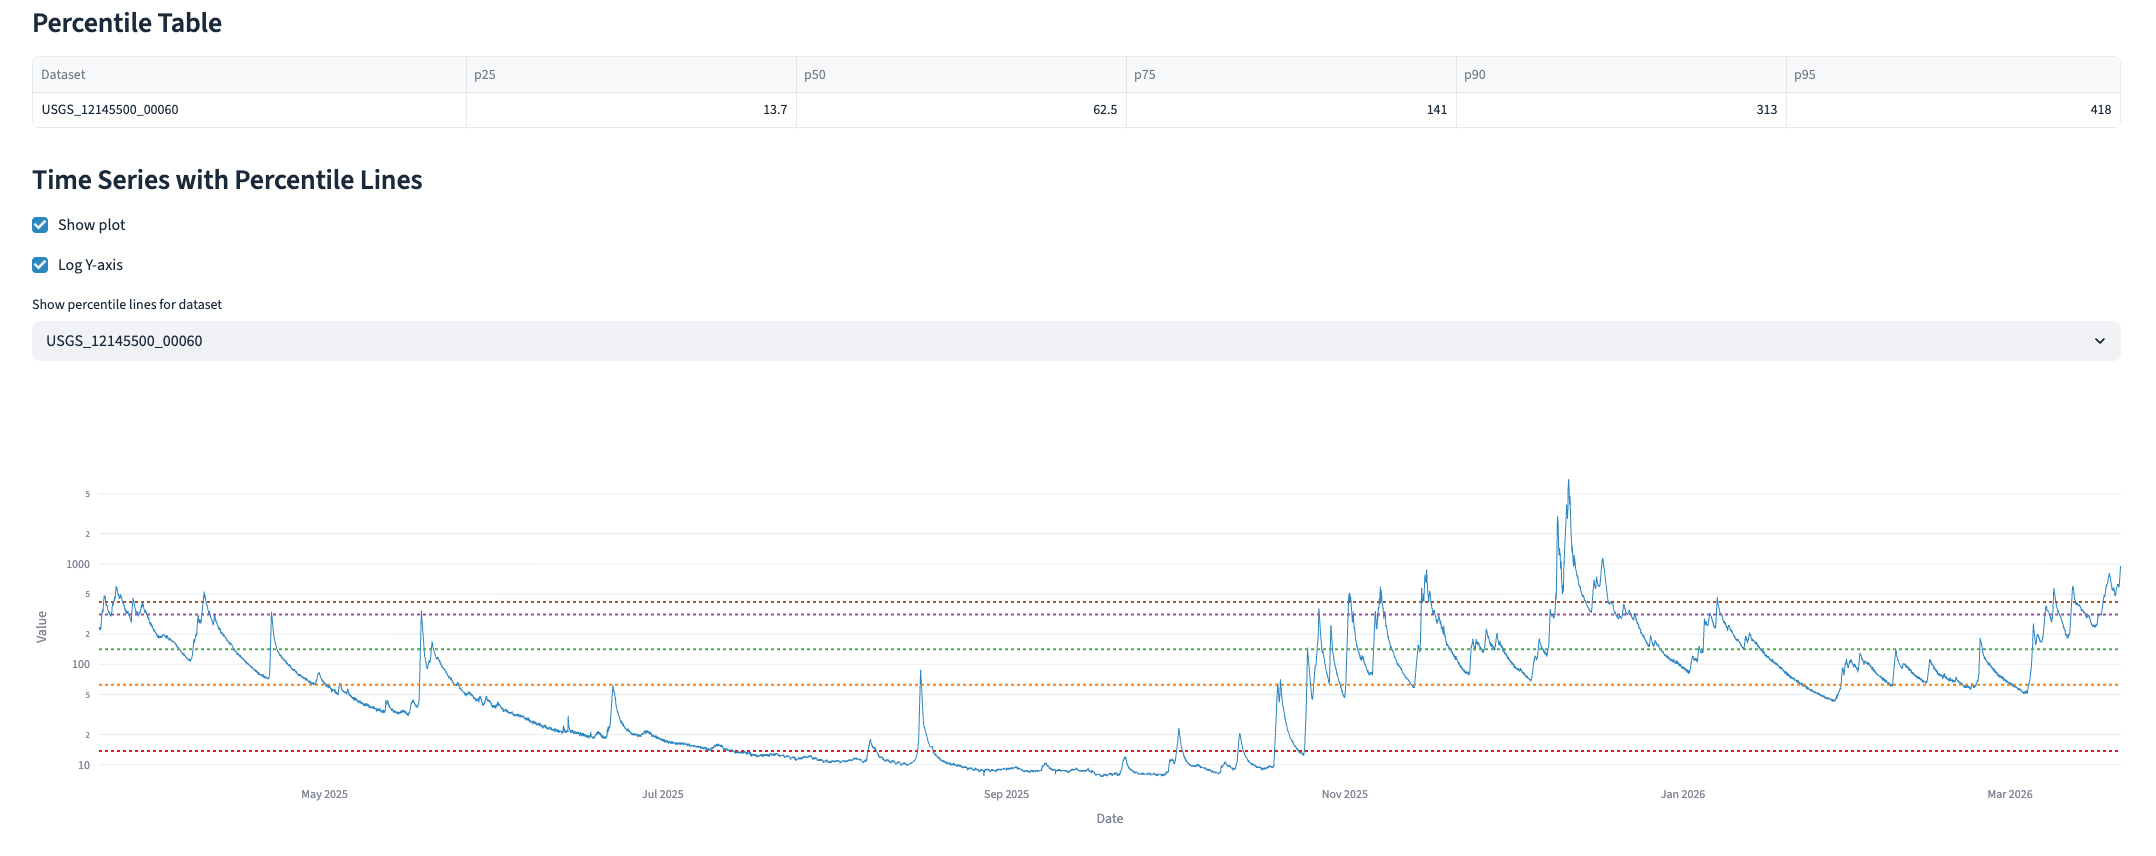
Percentiles analysis:
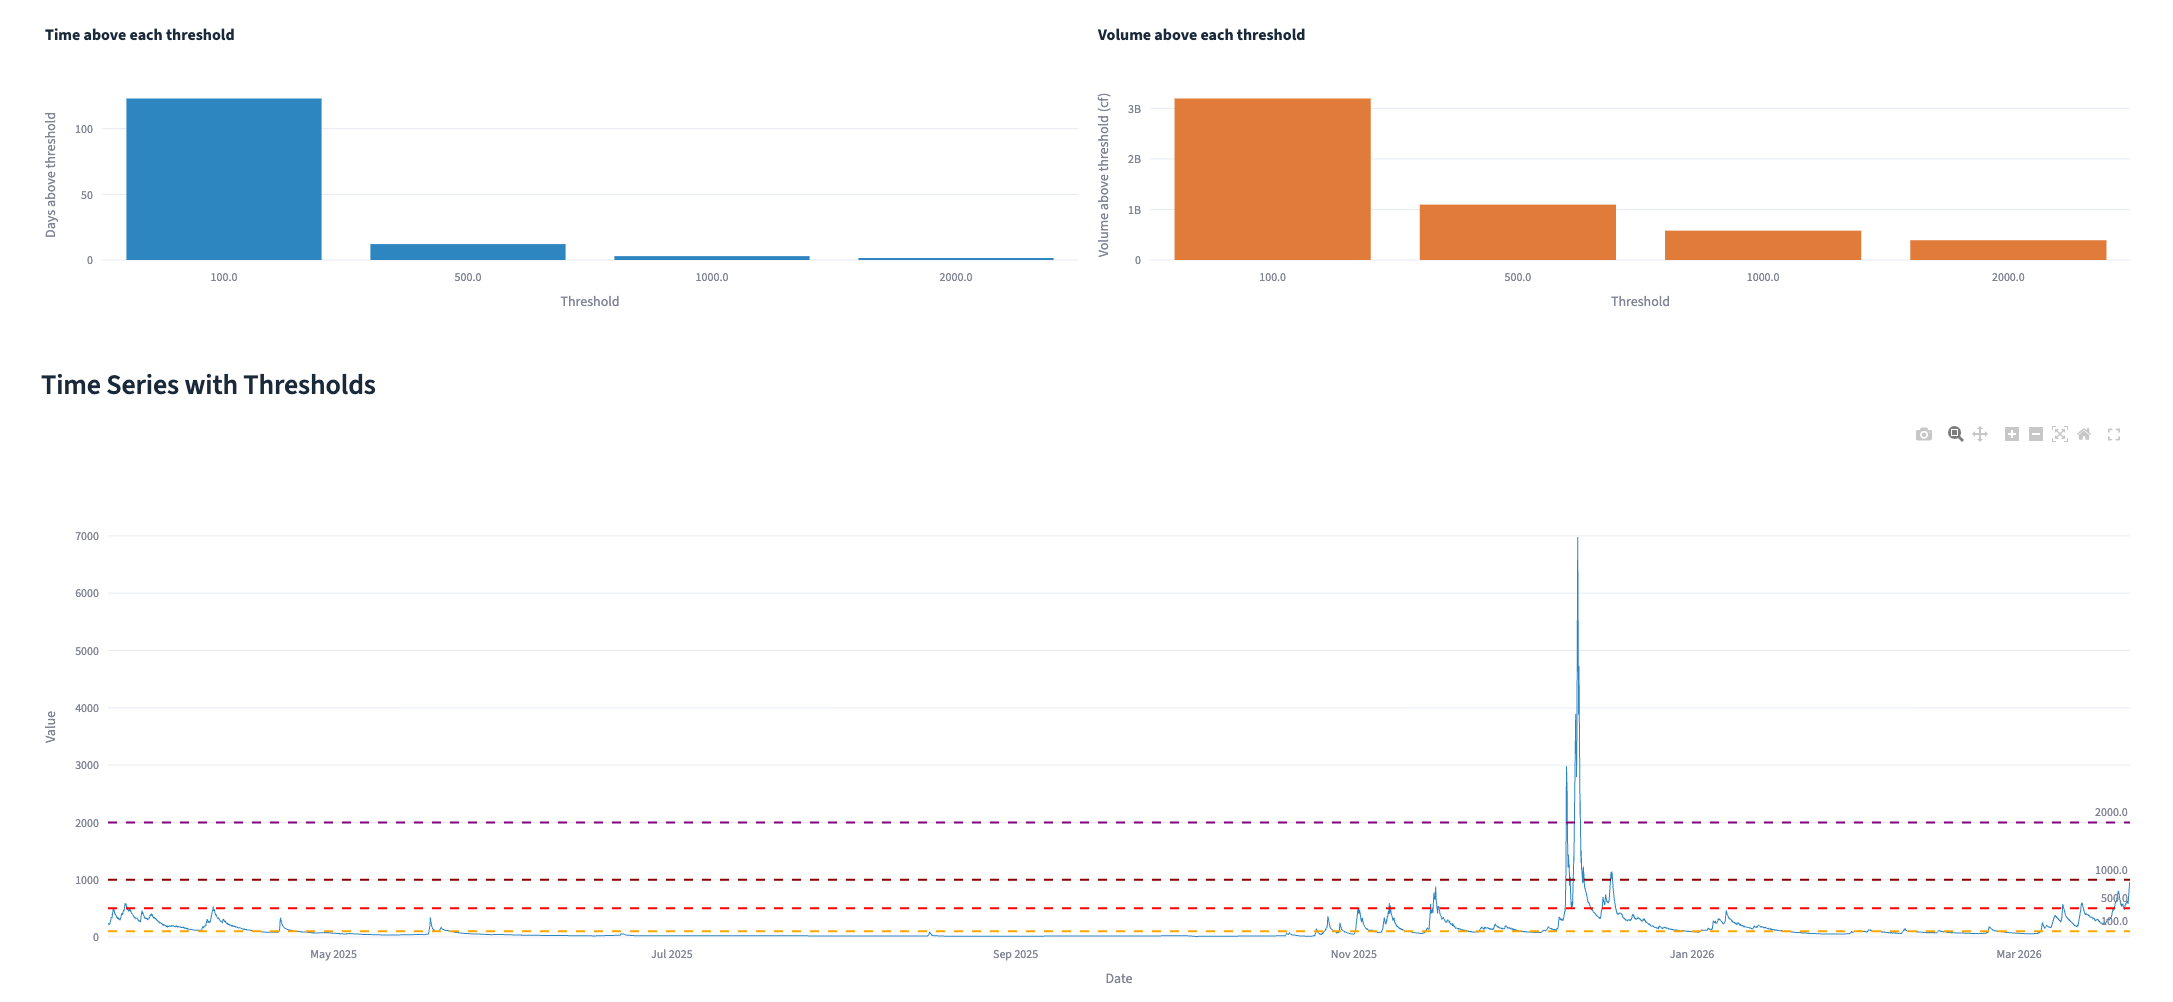
Discharge days:
Takeaways:
- Plotly is easy to use, but struggles with large datasets
- Streamlit is great for quick data applications
- Compiling USGS and Army Corps of Engineers Fortran utilities on an ARM64 Mac is leisure activity for lunatics